The Importance of Buoy Wave Spectra
By Drstuess on 12/14/2023
Why do you look at buoy and wave forecast data? I don't want to be presumptive, but if you are a surfer it is likely to get informed of the current and future wave conditions to better understand how the surf will be. If you ever pull up the basic buoy landing page from NOAA for the Block Island Buoy or hear someone reference a buoy reading, you most likely see a single height and period referenced with maybe a direction thrown in. This value is typically the Significant Wave Height (highest 1/3 of waves over a sample period), dominant wave period (period bucket with the most energy), and direction that most of the swell from the dominant period is coming from. In a simple world the area of ocean you are interested in only has a single swell or wave component present and this simple read out of X' @ Y seconds is all you need.
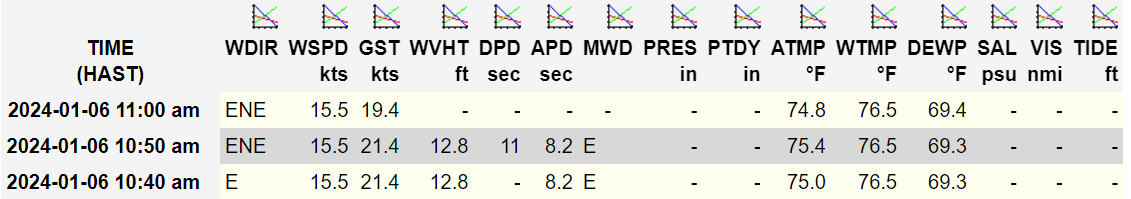 Image 1: Typical data on offer from NOAA Buoys
Often, however, there is more than a single swell present. This could be a combination of several swells from separate storms, or the superposition of local wind waves and longer period swell. In this case, a single reading of significant wave height and dominant period does not tell you all you might want to know about the waves. There are other singular wave parameters that can provide a little more insight (such as swell height, etc), but this is really where wave spectrum become valuable.
Wave Spectrum
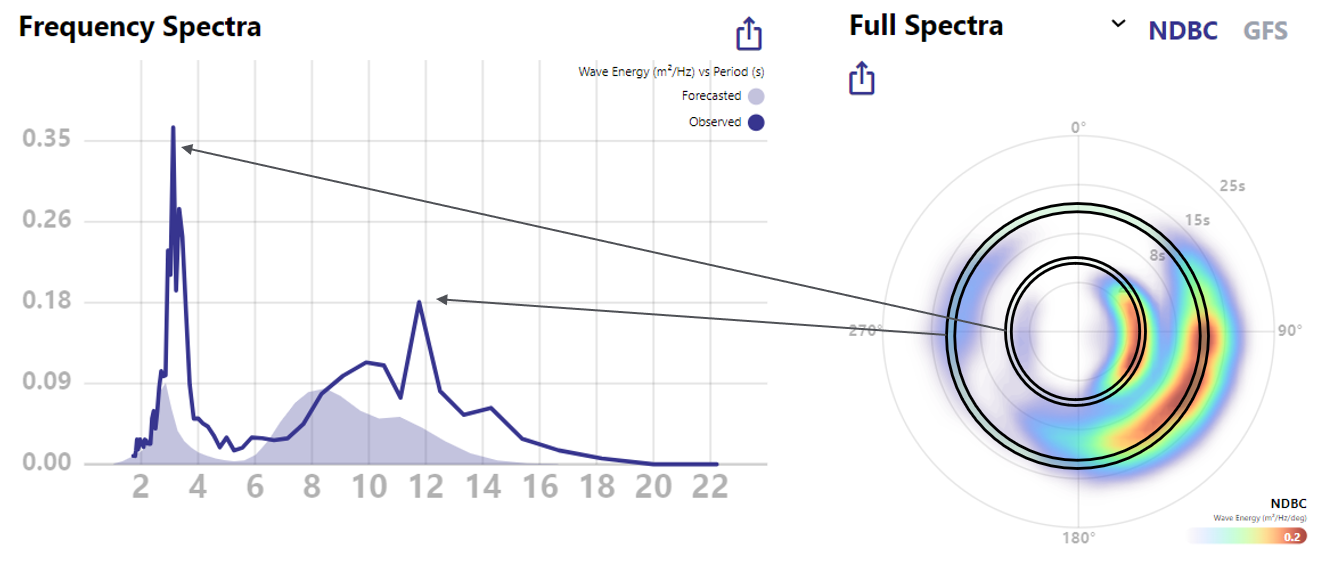 Image 2: Translation of Full spectrum data to 2D spectrum
Fundamentally, buoys measure the movement of the buoy, but then break that movement into different frequency (and direction) buckets to try and parse out the different swell and wave components that exist. This provides a full view of how the wave energy (more to come on this at a later time) is distributed across both direction and period, and can prove very valuable to a surfer.
Two dimensional frequency spectrum shows the breakdown of wave energy across the period spectrum. This can be very helpful in revealing multiple swells of different period that exist at one time. As referenced above, this is typically when there is lower period, more local local wind swell and longer period swell both present.
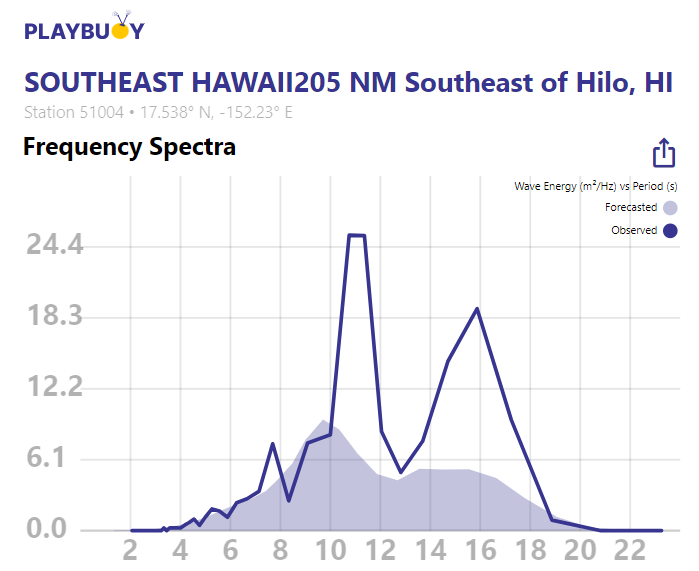 Image 3: Frequency Spectrum showing long period and mid period swell
The value of this is illustrated when looking at this reading from Buoy 51004 Southeast of Hawaii. If you were to just look at the significant wave height and dominant period, you would see 12.8' @ 11 seconds. You would not know that there is also a substantial 16 second component present. This can have important implications for surfing. An example of this for the northeast may be when there is a longer period hurricane swell running, but it may be obfuscated by shorter period wind swell.
2D wave spectrum have their limitations however. First, in the above example from Buoy 51004, you have no idea which direction the 16 second period swell is coming from. The dominant direction will show you where the 11 second swell is coming from, but not the 16 second. This introduces the value of also looking at the directional spectra or full spectra, which reveal which direction the wave energy is coming from. Playbuoy features several buoy views showing this directional information.
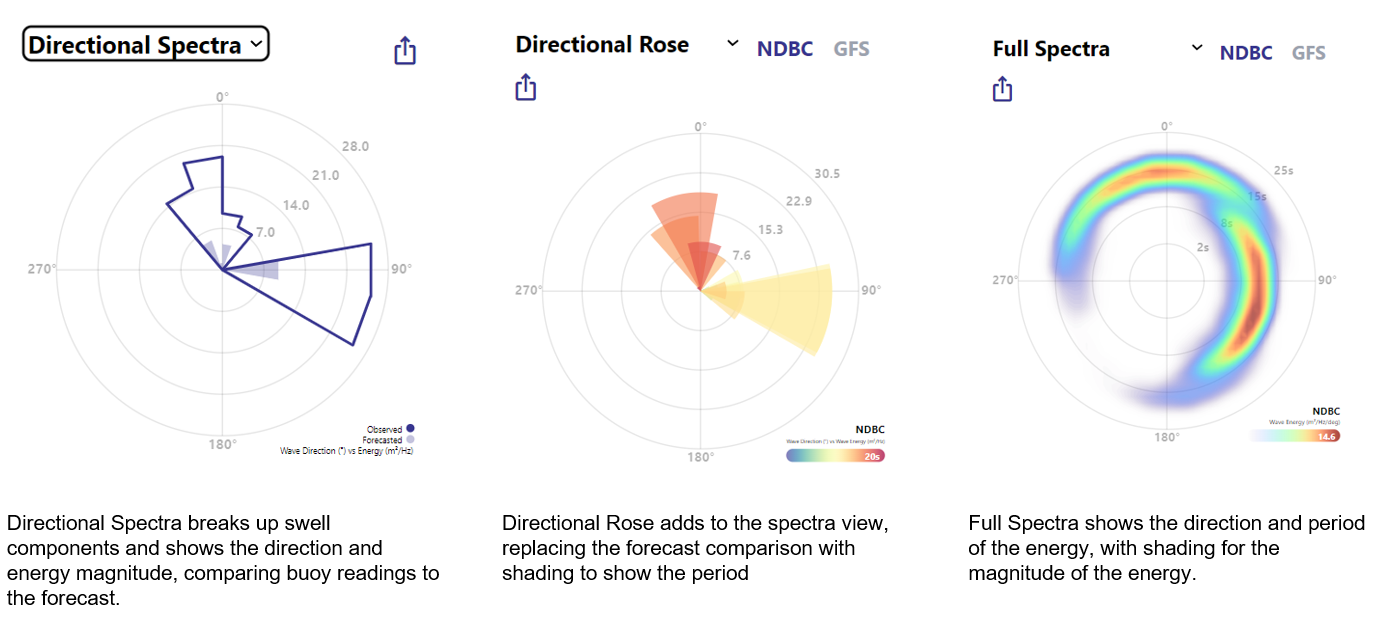 Image 4: Sampling of directional views offered by Playbuoy. More exist, so explore the site!
Further, there may be two swells of similar period but from different directions on the buoy. In this case the 2D spectrum will not reveal this at all. This is shown with an upcoming forecast for the Block Island Buoy. Simply looking at the Significant Wave Height or 2D spectrum will not reveal both a S and E swell of 8-9 second period.
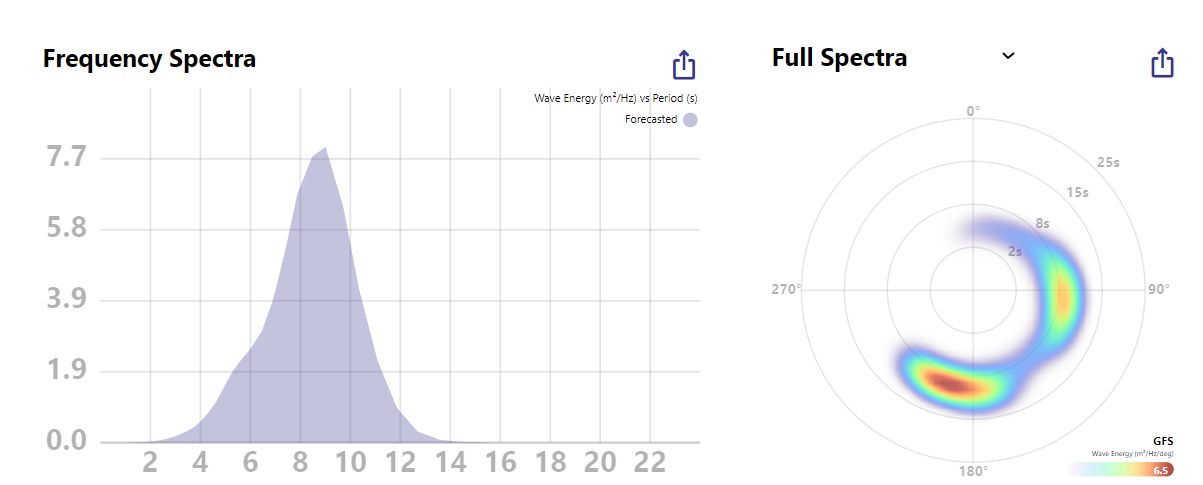 Image 5: Combo swell on tap for Northeast on Sunday
Hopefully this helps everyone and helps you get more out of playbuoy. Visit the blog page for more write-ups to come.